[Visualization in Python] Plotly Annotation 기본 튜토리얼
안녕하세요! 오늘은 Plotly의 Annotation의 기본 튜토리얼을 포스팅하려고 합니다! Annotation 기능이 무엇이냐구요? 한마디로 플롯에 메모를 남기는 것이라고 할 수 있습니다. 특히 플롯에서 특정 지점 또는 데이터 포인트에 코멘트를 남기고 싶을 때 매우 유용합니다. Annotation의 모양, 크기, 위치 등을 자유자재로 설정할 수 있게 되면, 시각적으로도, 정보적으로도 데이터 플롯을 확실히 더욱 업그레이드 할 수 있는 것 같습니다! 일단 이번 포스트에서 다루게 될 파라미터들은 다음과 같습니다.
1. 기본(텍스트)
- x : x좌표
- y : y좌표
- text : 삽입할 텍스트
- showarrow : 화살표 보일지의 여부
- xshift : annotation의 위치 이동 (x축)
- yshift : annotation의 위치 이동 (y축)
- font : 텍스트 설정
- family : 글씨체
- size : 글씨 크기
- color : 글씨 색
- bordercolor : 글씨 테두리 색
- borderwidth : 글씨 테두리 두께
- borderpad : 글씨와 테두리 사이 간격(?)
- bgcolor : 글씨 배경색
- opacity : 투명도
2. 화살표
- arrowcolor : 화살표 색
- arrowsize : 화살표 사이즈
- arrowwidth : 화살표 두께
- arrowhead : 화살표 머리 크기
- ax : 화살표 방향 변경 (x축)
- ay : 화살표 방향 (y축)
아래 내용에 대한 코드는 이곳에 있습니다.
1. 마커 위 텍스트
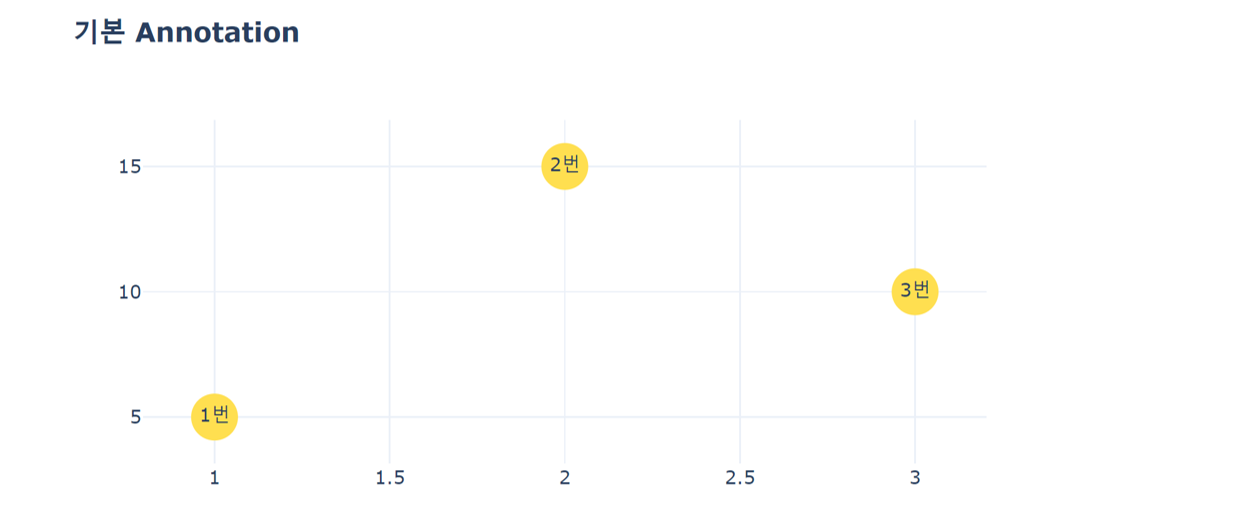
이제 찬찬히 위의 파라미터들을 알아보겠습니다! 먼저 간단하게 3개의 마커를 찍어보겠습니다. 마커 위에 텍스트를 표시하고 싶을 때에는 fig.add_trace에서 mode=’markers+text’ 로 변경하면 됩니다!
import plotly.graph_objects as go

x = [1, 2, 3]
y = [5, 15, 10]
text = ['1번', '2번', '3번']

marker_style = dict(size=30, color='rgb(255,223,80)')

fig = go.Figure(layout=dict(width=700, height=400, template='plotly_white', title='<b>기본 Annotation</b>'))
fig.add_trace(go.Scatter(x=x, y=y,mode='markers+text', marker=marker_style, text=text))
2. 화살표 선택 여부
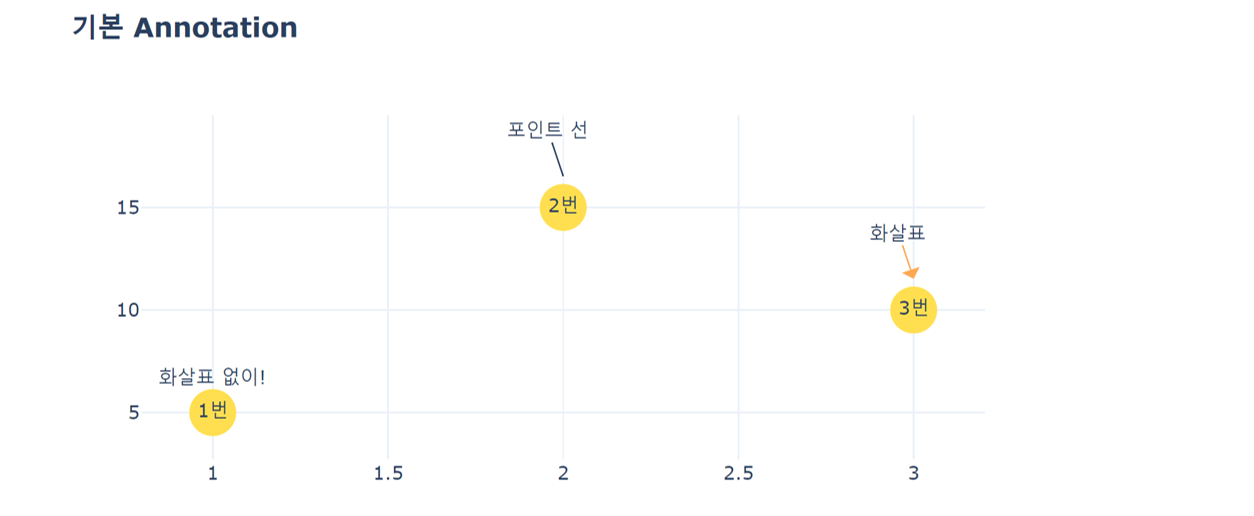
보통 Annotation은 특정 마커에 대해 코멘트를 남길 때 주로 사용합니다. 때문에 기본적으로 그 포인트를 가르키는 선이 존재합니다! 물론 이 선을 없앨 수도, 화살표로 만들 수도 있습니다. 자, 먼저 x와 y에 강조할 마커의 x좌표, y좌표를 입력합니다.
- showarrow=False 로 할 경우 텍스트만 남게 되고, showarrow=True 로 할 경우 선이 존재하게 됩니다.
- showarrow=True 일 때, arrowhead에 1 이상의 숫자를 입력할 경우 그 크기만큼의 화살표 머리가 생깁니다!
- 그 외에 yshift 를 이용해서 annotation의 위치를 위아래로 움직일 수 있고, arrowsize, arrowcolor 등을 이용해서 화살표를 꾸밀 수 있습니다.
annotations =[]
annotations.append(dict(x=1, y=5, showarrow=False,text="화살표 없이!",yshift=23)) # 1번
annotations.append(dict(x=2, y=15, showarrow=True,text="포인트 선", yshift=20)) # 2번
annotations.append(dict(x=3, y=10, showarrow=True,text="화살표", arrowcolor='rgb(253,168,83)',
                        arrowhead=1,arrowsize=2,yshift=20)) # 3번

fig.update_layout(annotations=annotations)
3. 화살표의 방향 및 길이 조절
화살표의 방향과 길이는 파라미터 ax, ay 를 이용합니다! ax는 x축에서의 방향을 조절합니다. ax의 값이 양수이면 화살표의 꼬리가 오른쪽으로 가고, 즉 마커를 기준으로 오른쪽에서 왼쪽으로 마커를 포인팅하고, 음수이면 마커를 기준으로 왼쪽에서 오른쪽으로 마커를 포인팅합니다. ay는 y축에서의 방향을 조절합니다. ay의 값이 양수이면 화살표의 꼬리가 아래로 가고, 즉 마커를 기준으로 아래에서 위로 마커를 포인팅하고, 값이 음수이면, 화살표의 꼬리가 위로 가서 아래 방향으로 마커를 포인팅하게 됩니다.
또 한, 플러스, 마이너스는 방향을 조절한다면, 절대값은 화살표의 길이를 조정합니다. arrowsize는 화살표의 전반적인 크기를 조절하고, ax, ay에 들어가는 숫자의 크기는 화살표가 얼마나 길어지는지 짧아지는지를 의미하는 것 같습니다! 아래 플롯에서 ax의 절대값은 50으로, 길이가 더 짧은 반면, ay의 길이는 90으로 길이가 더 긴 것을 확인할 수 있습니다.
x = [1, 2, 3, 4]
y = [5, 15, 10, 5]
text = ['1번', '2번', '3번', '4번']

marker_style = dict(size=30,color='rgb(255,223,80)')

fig = go.Figure(layout=dict(width=700, height=400, template='plotly_white', title='<b>기본 화살표 방향</b>'))
fig.add_trace(go.Scatter(x=x, y=y, mode='markers+text', marker=marker_style, text=text))
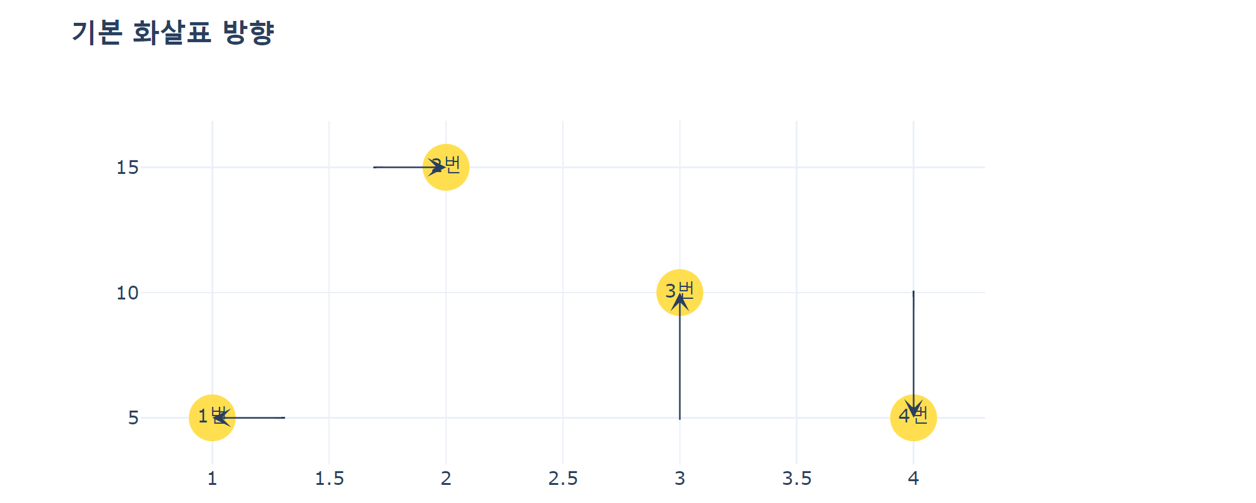
ax, ay 각각에 적당한 값을 넣어 화살표의 방향을 자유자재로 조절할 수 있습니다!
annotations =[]
annotations.append(dict(x=1, y=5, arrowsize=2, arrowhead=3, ax=50, ay=0)) # 1번
annotations.append(dict(x=2, y=15, arrowsize=2, arrowhead=3, ax=-50, ay=0)) # 2번
annotations.append(dict(x=3, y=10, arrowsize=2, arrowhead=3, ax=0, ay=90)) # 3번
annotations.append(dict(x=4, y=5, arrowsize=2, arrowhead=3, ax=0, ay=-90)) # 4번

fig.update_layout(annotations=annotations)
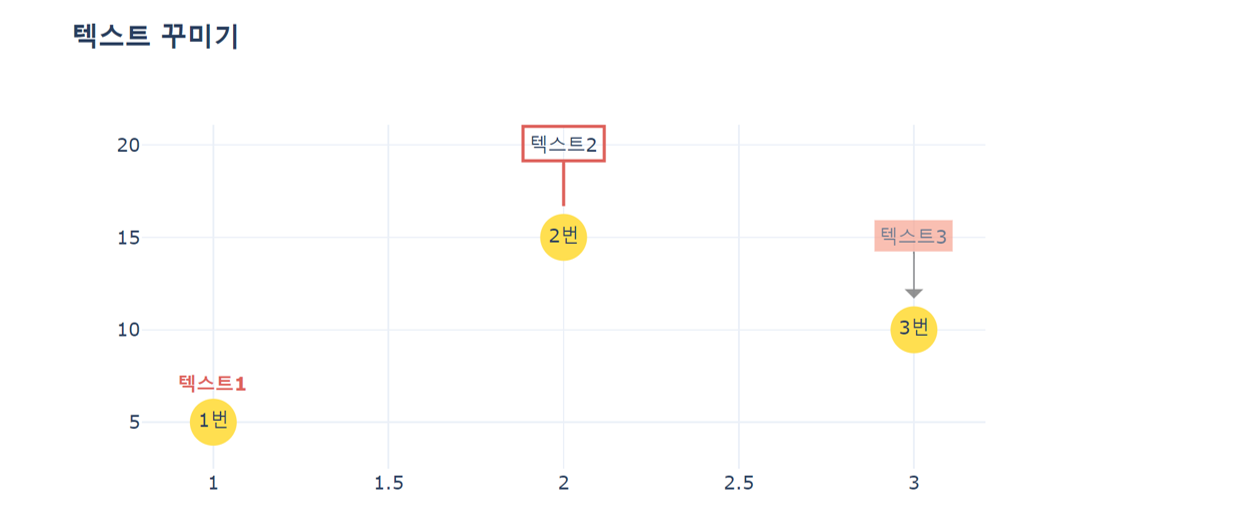
4. Annotation 꾸미기
다음은 Annotation을 꾸미는 법입니다!
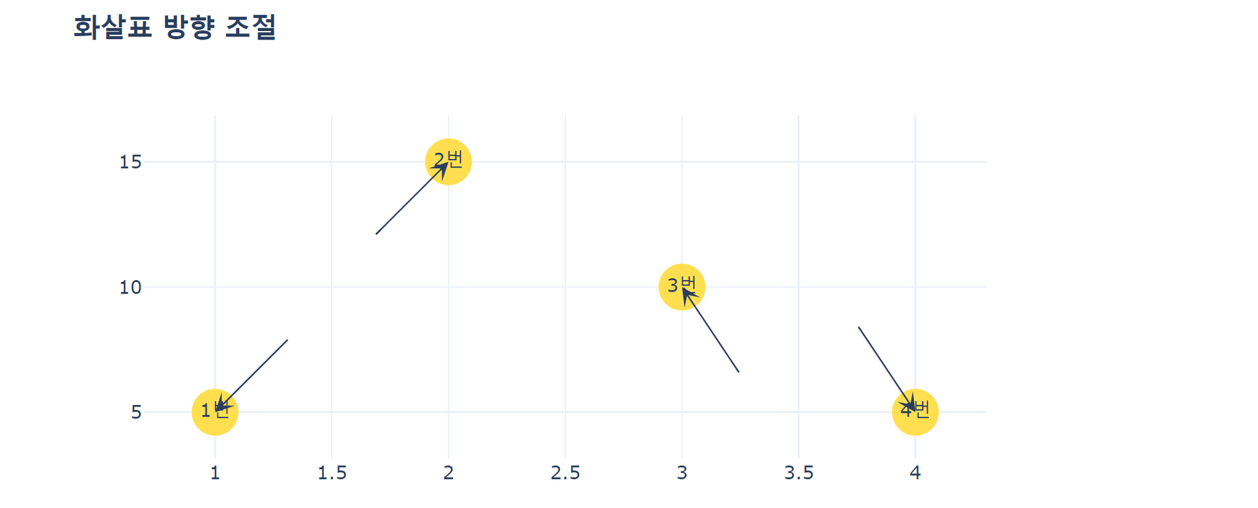
- 1번: 텍스트만을 변경합니다. font 를 이용해서 size와 color를 변경하면 됩니다.
- 2번: arrowcolor, bordercolor, borderwidth 등을 이용해서 화살표와 테두리의 경계의 두께, 색을 변경합니다. borderpad 를 이용해서 텍스트와 테두리의 간격을 조정할 수 있습니다!
- 3번: bgcolor, opacity 등을 이용해서 텍스트의 배경과 투명도를 조절할 수 있습니다.
annotations =[]
annotations.append(dict(x=1, y=5, arrowsize=2, arrowhead=3, ax=50, ay=-50)) # 1번
annotations.append(dict(x=2, y=15, arrowsize=2, arrowhead=3, ax=-50, ay=50)) # 2번
annotations.append(dict(x=3, y=10, arrowsize=2, arrowhead=3, ax=40, ay=60)) # 3번
annotations.append(dict(x=4, y=5, arrowsize=2, arrowhead=3, ax=-40, ay=-60)) # 4번

fig.update_layout(annotations=annotations)
여기까지 Plotly annotation의 기본적인 사용방법이었습니다! 더 많은 예제는 Plotly 공식 홈페이지를 참고하시면 될 것 같습니다. 감사합니다 :)